
False Narratives Challenged in Placer County
Roseville, Calif. – Placer County, long a bastion of conservatism in California continues to change. In the process of moving to a more diverse, pluralistic region, Placer County has grown into a safer, better-educated, and significantly more prosperous community than ever before.
Waves of development, relative housing affordability, family friendly neighborhoods and favorable weather continue to attract highly educated residents and entrepreneurs from throughout California and the nation.
Population Influx = Lower Crime Rates
These changes have brought greater diversity, economic prosperity, and lower crime rates according to local law enforcement records. These trends have bucked political, media, and social media propaganda, that capitalizes on people’s politics and fears in the age of misinformation. The growth has also delivered some of the big challenges communities face during periods of rapid growth such as a dramatic increase in traffic congestion and pressures on affordable housing.
Republican advantage has declined
According to Official Placer Elections data, Republican voter registration over the last two decades years has plummeted (data chart below). However, Republicans still retain a sizable advantage in Placer County. For example, in both 2020 and 2024, Donald Trump outperformed statewide results in Placer County.
As of May 2026, there are a total of 297,502 registered voters in Placer County, another monthly decrease of about 798 total voter registrations since last report. Placer County has been actively reducing eligible voters by requiring some to update their signatures that have been previously accepted.
Dissatisfaction with both major parties
The voter registration data also shows the biggest percentage change is that of voters not wishing to be associated with either major political party. Despite the long-term trend and downward trajectory of Republican registrations, Democratic registrations have only moved up slightly over the same period. No Party preference accounts for nearly 20 percent of registered voters with smaller political party registration rounding out the remaining eight plus percentage of registered voters.
Active Local Voters
Ryan Ronco, Placer County Clerk-Recorder-Registrar of Voters shared that Placer County is “historically 10 to 15 percentage points above the California average turnout each major election.” Placer County also currently ranks #2 for percentage of registered voters in California.
Placer County Voter Registration
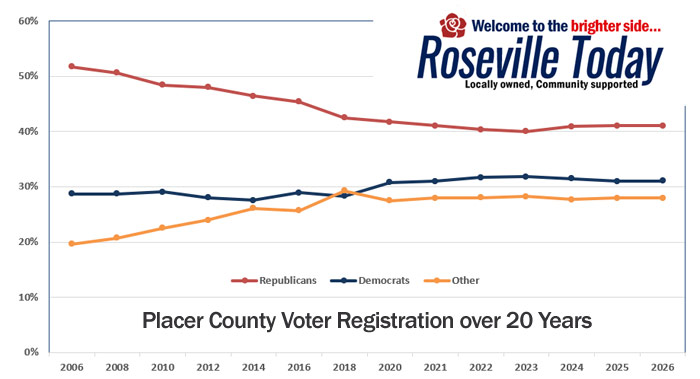
Political registrations over time: Updated May 2026
| Year | Rep | Dem | Other |
|---|---|---|---|
| 2006 | 51.70% | 28.69% | 19.61% |
| 2008 | 50.59% | 28.70% | 20.71% |
| 2010 | 48.39% | 29.07% | 22.54% |
| 2012 | 47.96% | 28.05% | 23.99% |
| 2014 | 46.37% | 27.54% | 26.09% |
| 2016 | 45.40% | 28.91% | 25.69% |
| 2018 | 42.48% | 28.27% | 29.25% |
| 2020 | 41.75% | 30.75% | 27.50% |
| 2021 | 40.73% | 31.33% | 27.94% |
| 2022 | 40.33% | 31.66% | 28.01% |
| 2023 | 39.99% | 31.79% | 28.22% |
| 2024 | 41.06% | 31.25% | 27.69% |
| 2025 | 41.06% | 31.00% | 27.94% |
| 2026 | 40.85% | 31.02% | 28.13% |
Data Sources: California Secretary of State
and Placer County
